In Their Words: A Practical Guide for Engaging Young People in Civic Education
Figures
In this section
Figures 1-11

Figure 1 Global Distribution of Survey Respondents
Note: 2 additional respondents did not identify their country/region
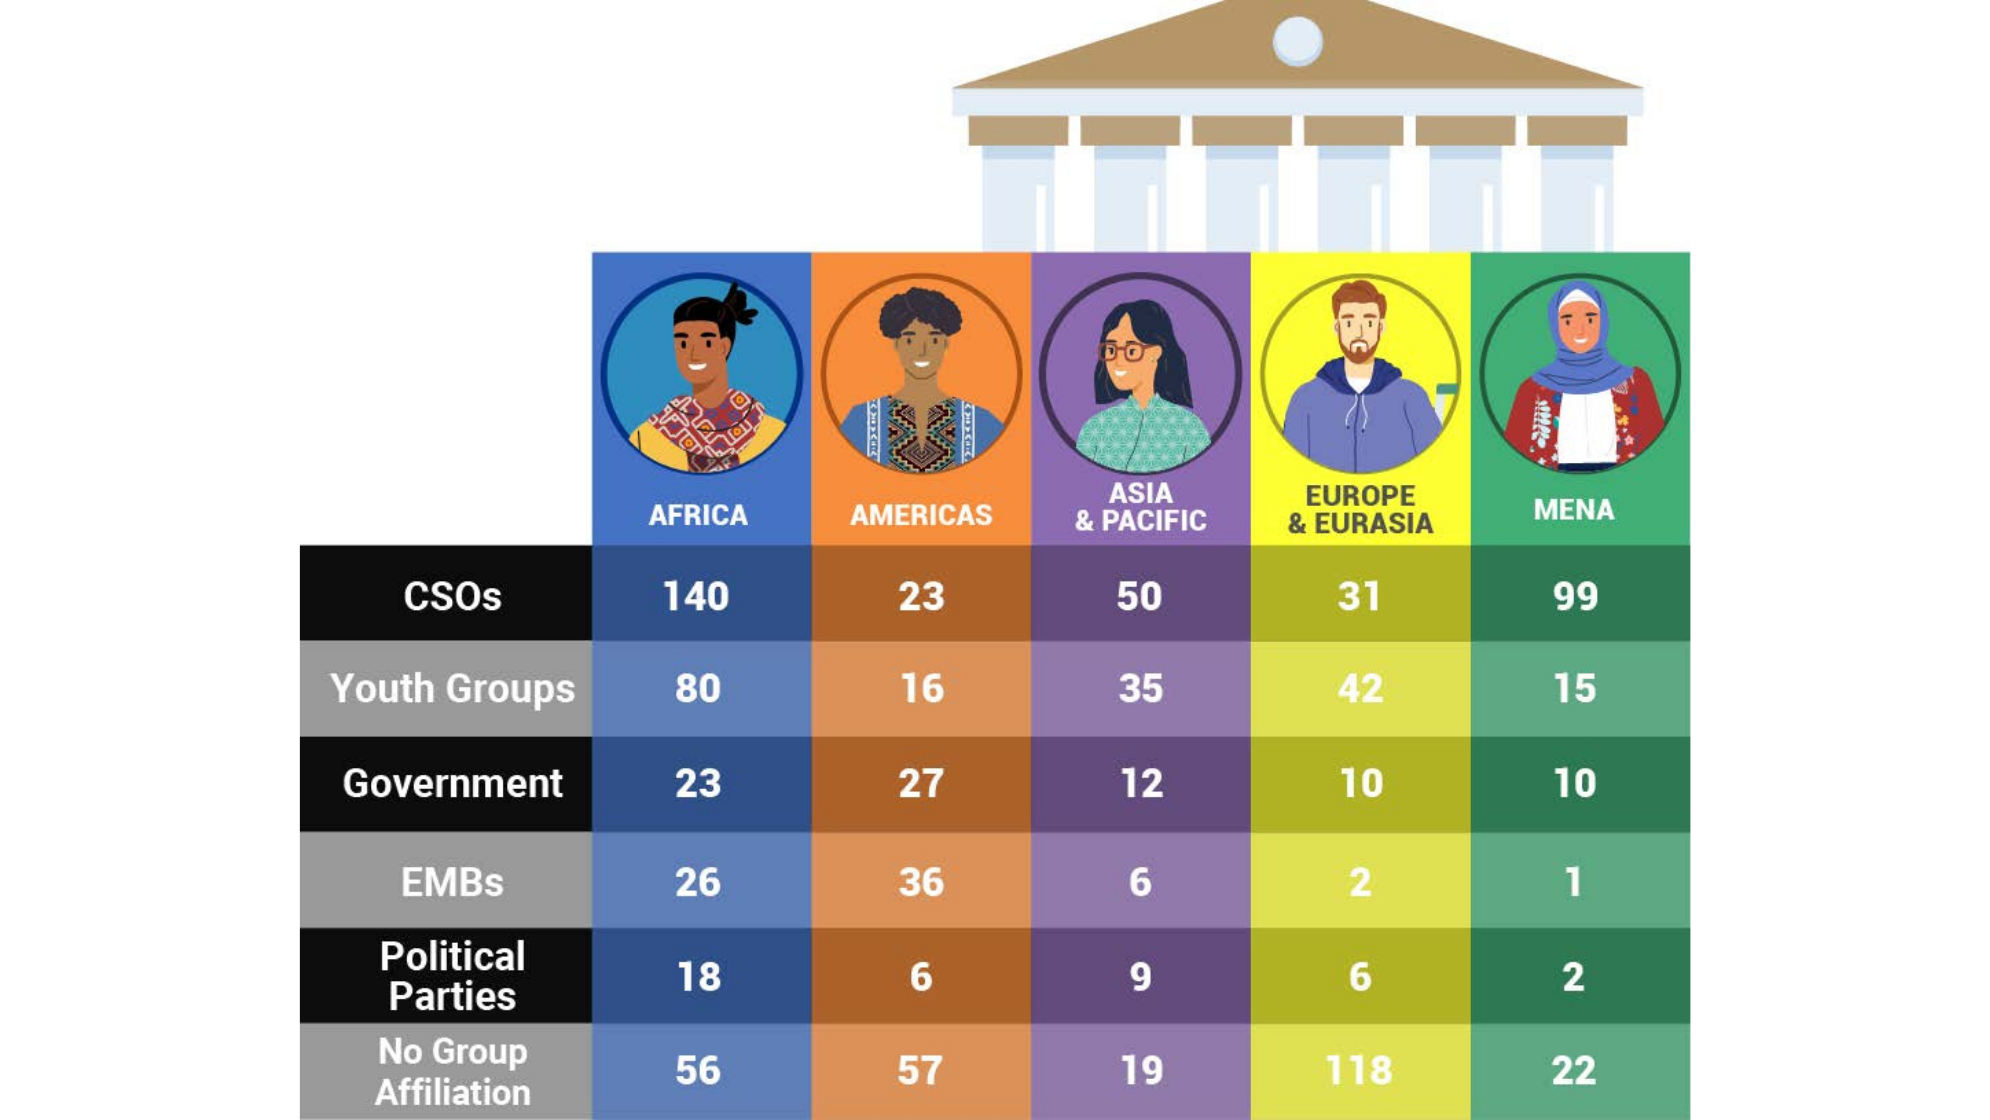
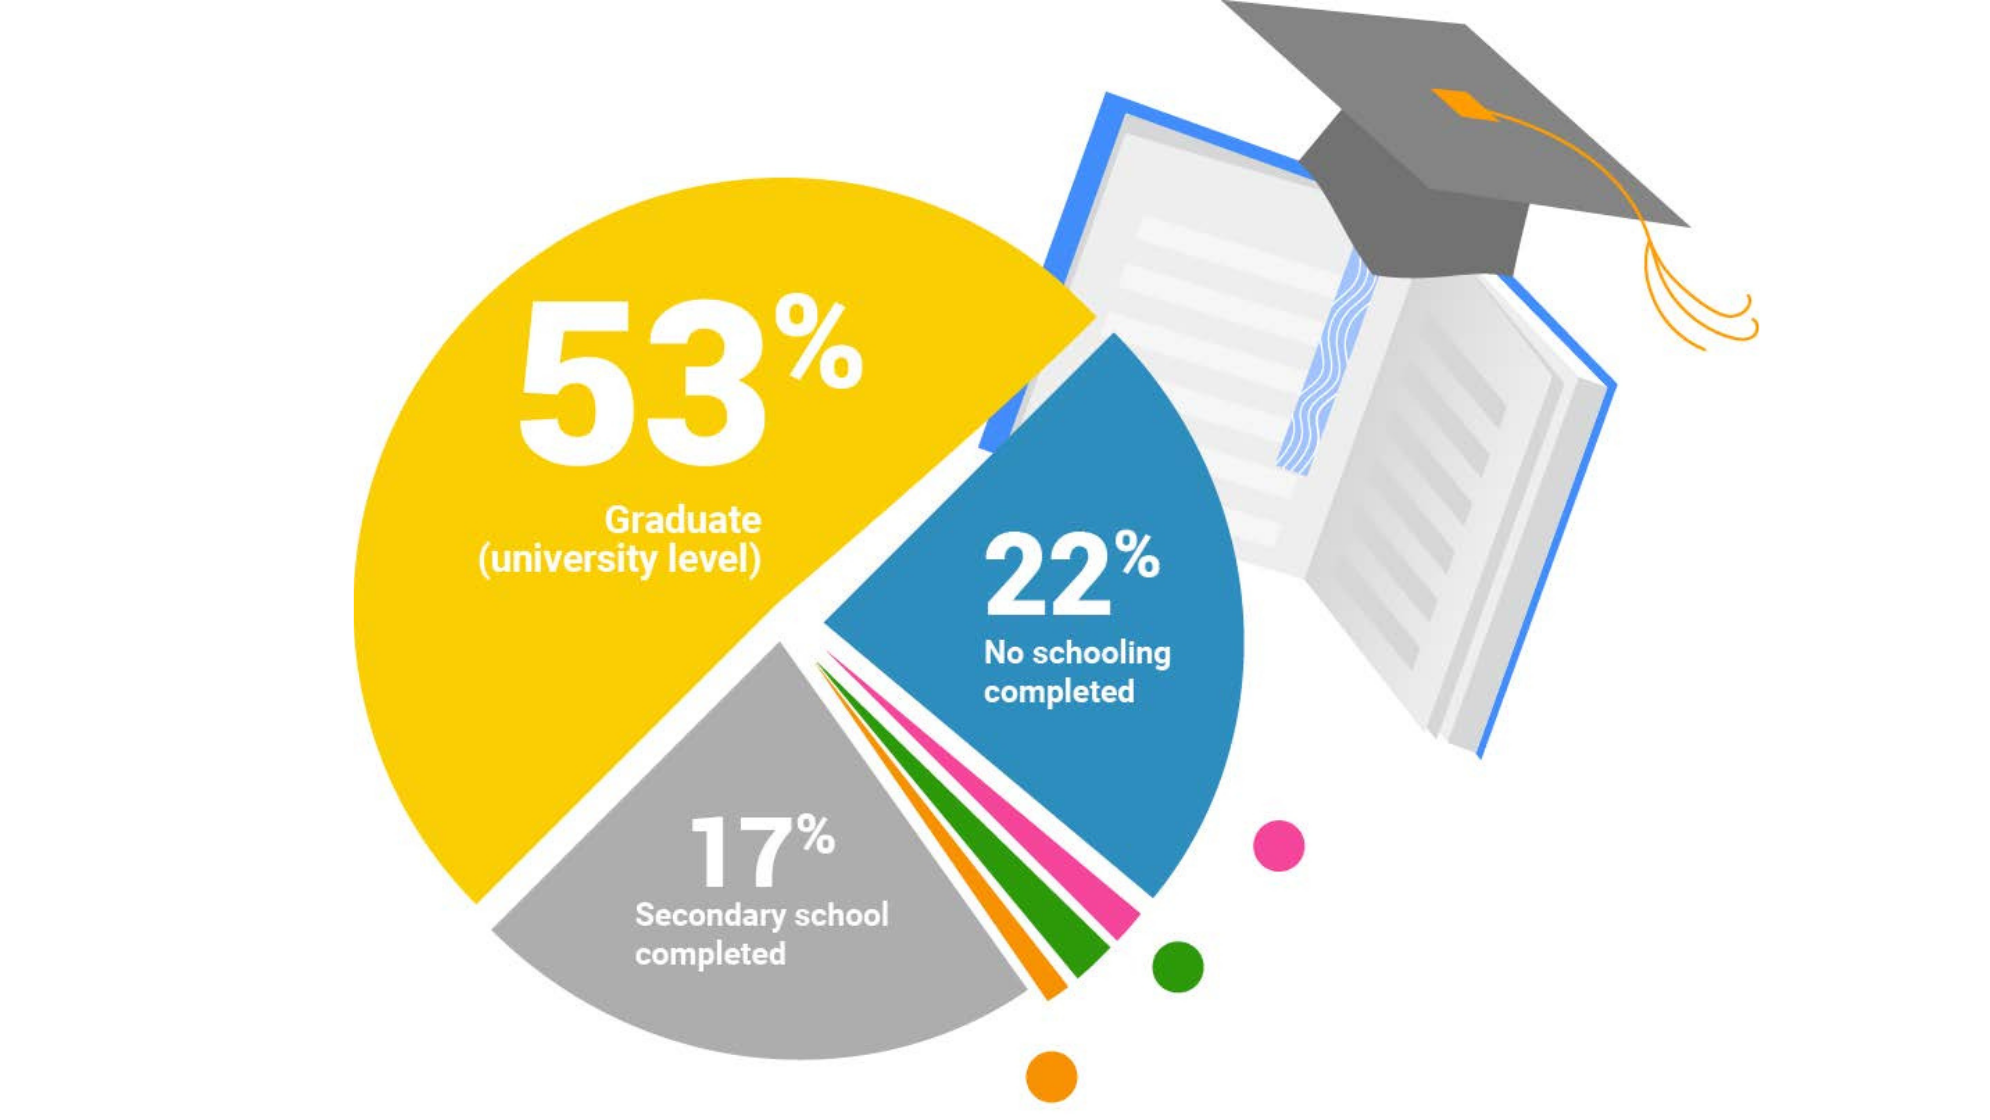
Figure 2 Survey Respondents' Organizational Affiliation, by Region

Figure 3 Survey Respondents' Highest Level of Education Completed

Figure 4 Survey Respondents' Geographic Location

Figure 5 Survey Respondents, by Age Group and Gender

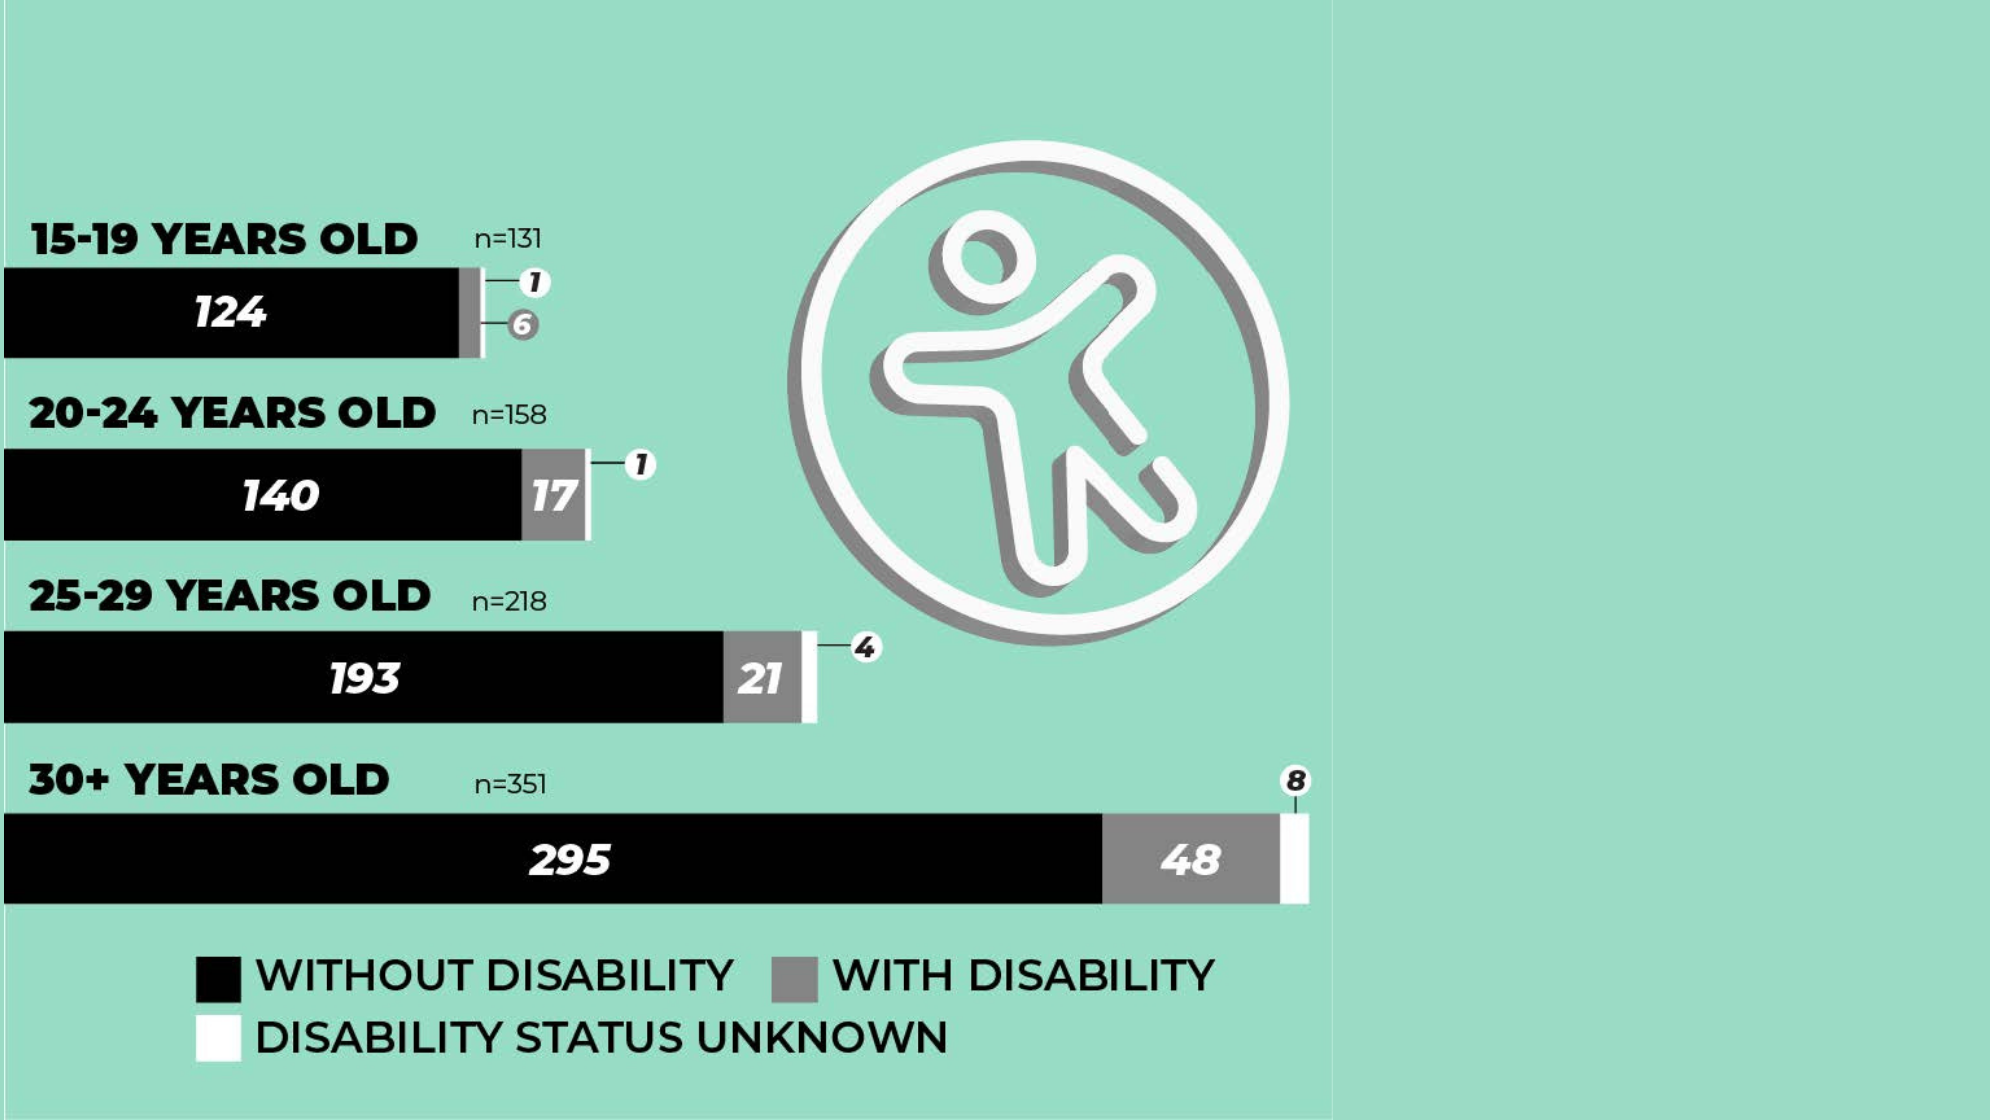
Figure 6 Survey Respondents by Age Group and Disability Status

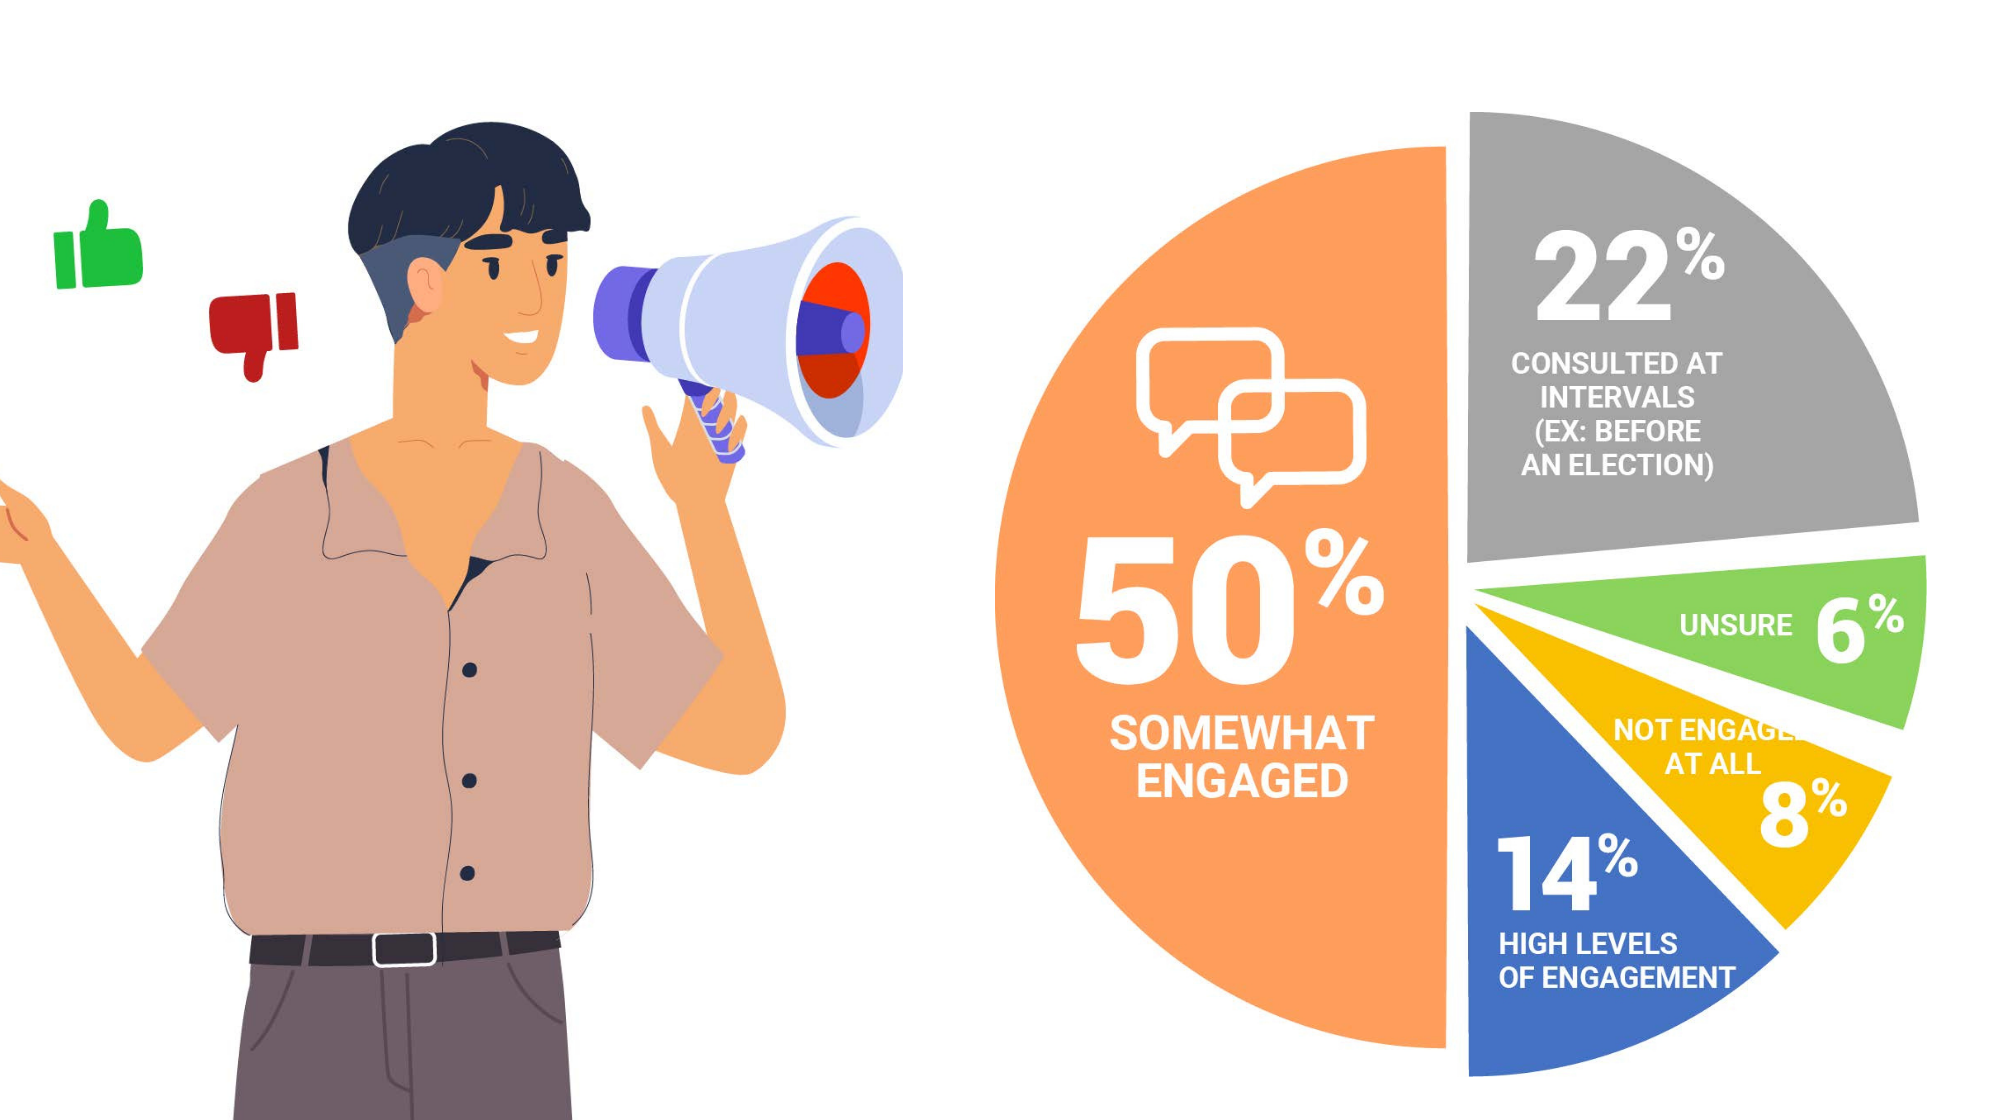
Figure 7 Observed Levels of Young People's Engagement in Electoral and Governance Processes

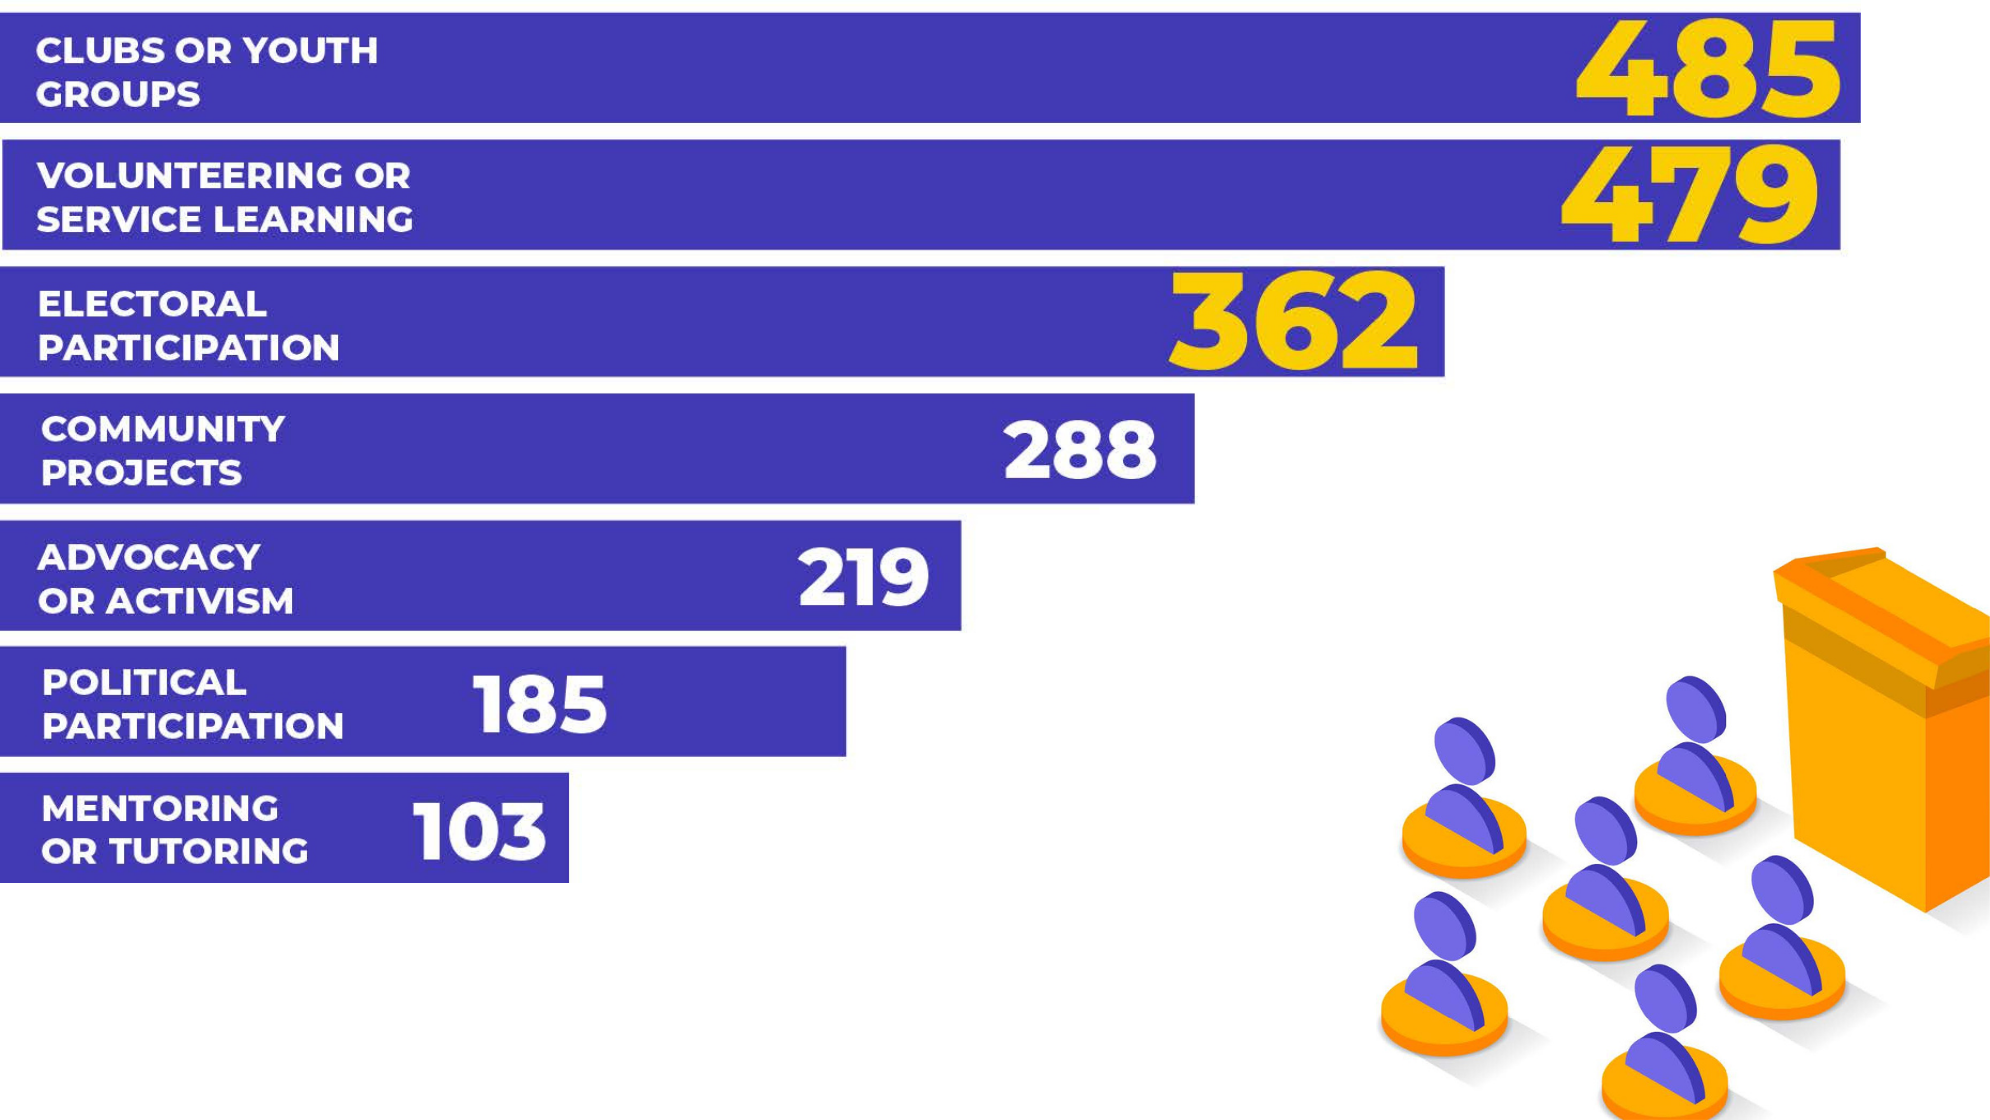
Figure 8 Young People’s Observed Engagement in Civic Processes
Note for Figure 8: N=858 respondents. Respondents were asked to choose the top three types of civic engagement that they observed young people participating in their country.
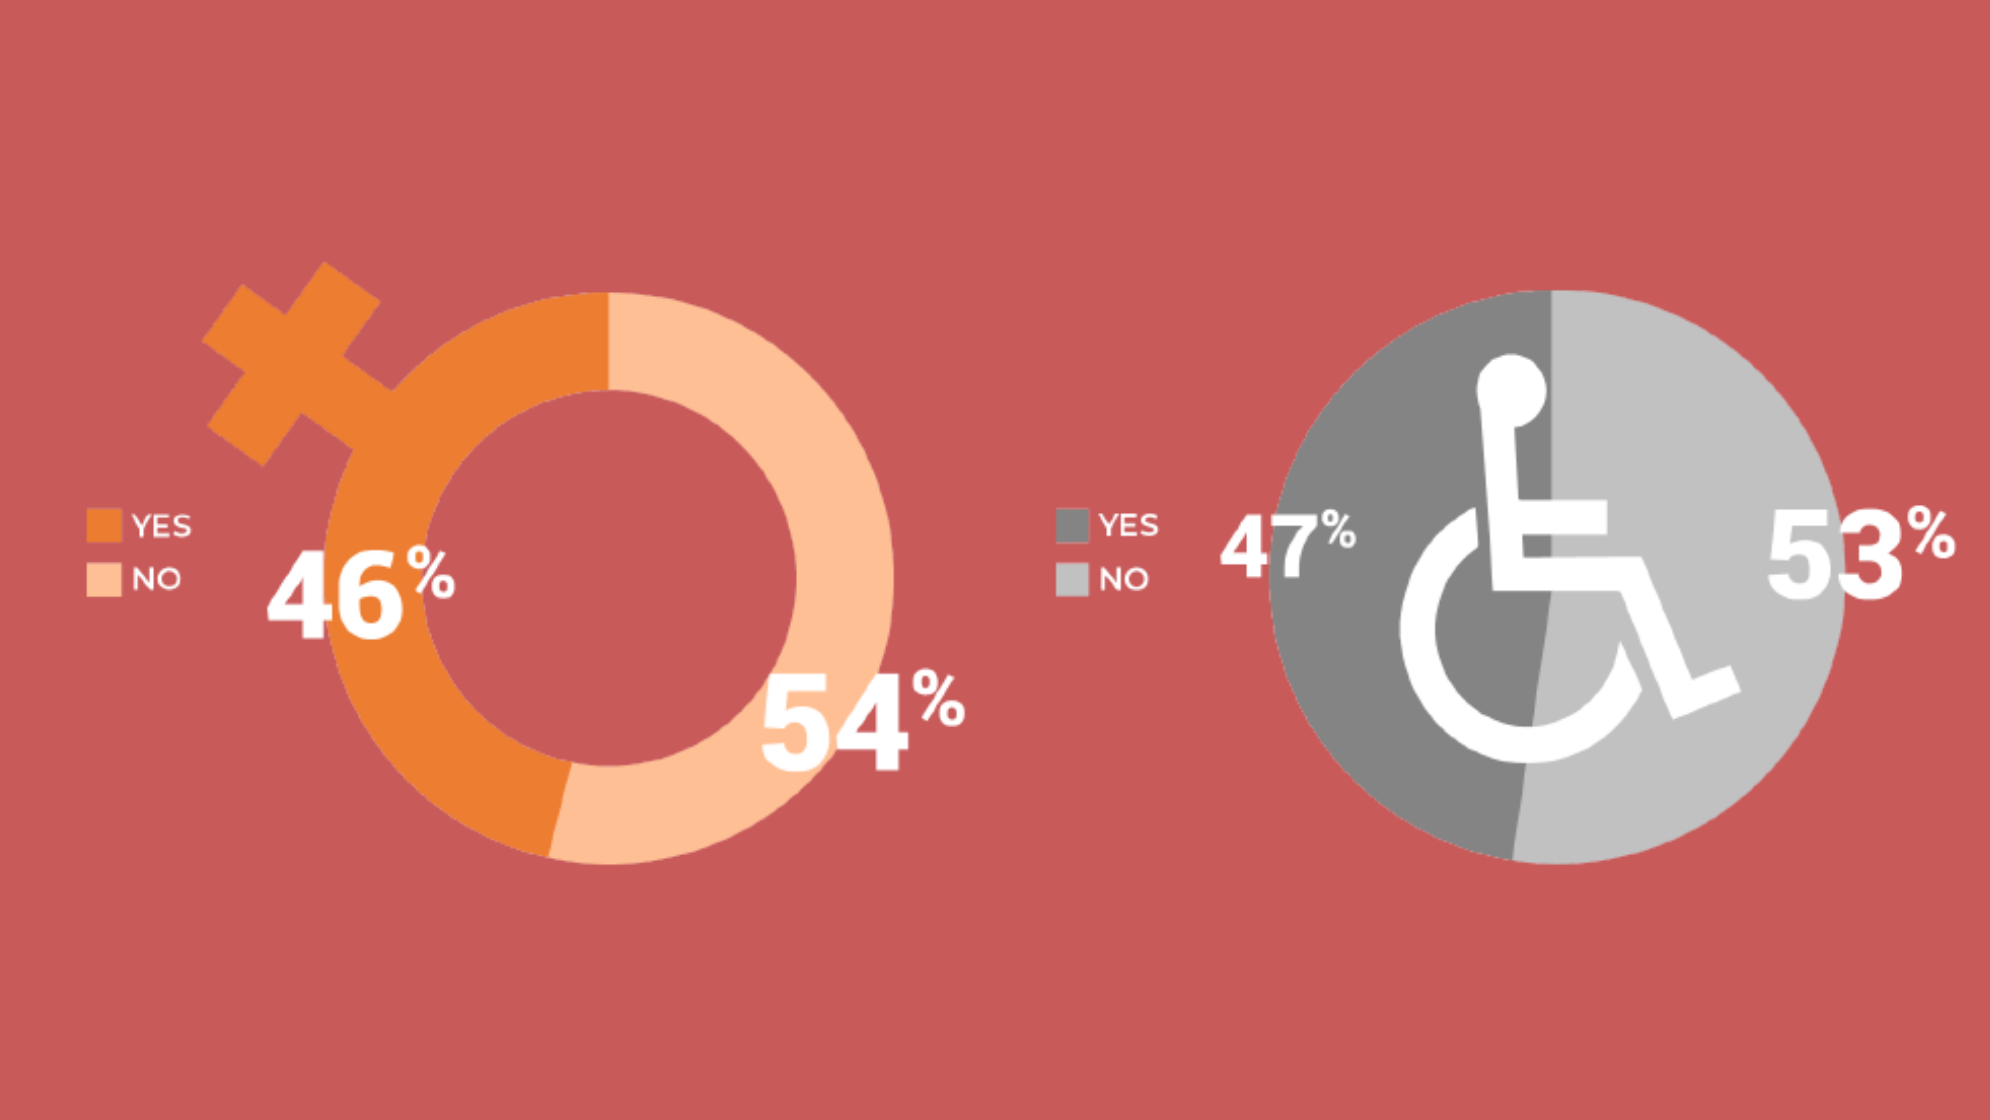

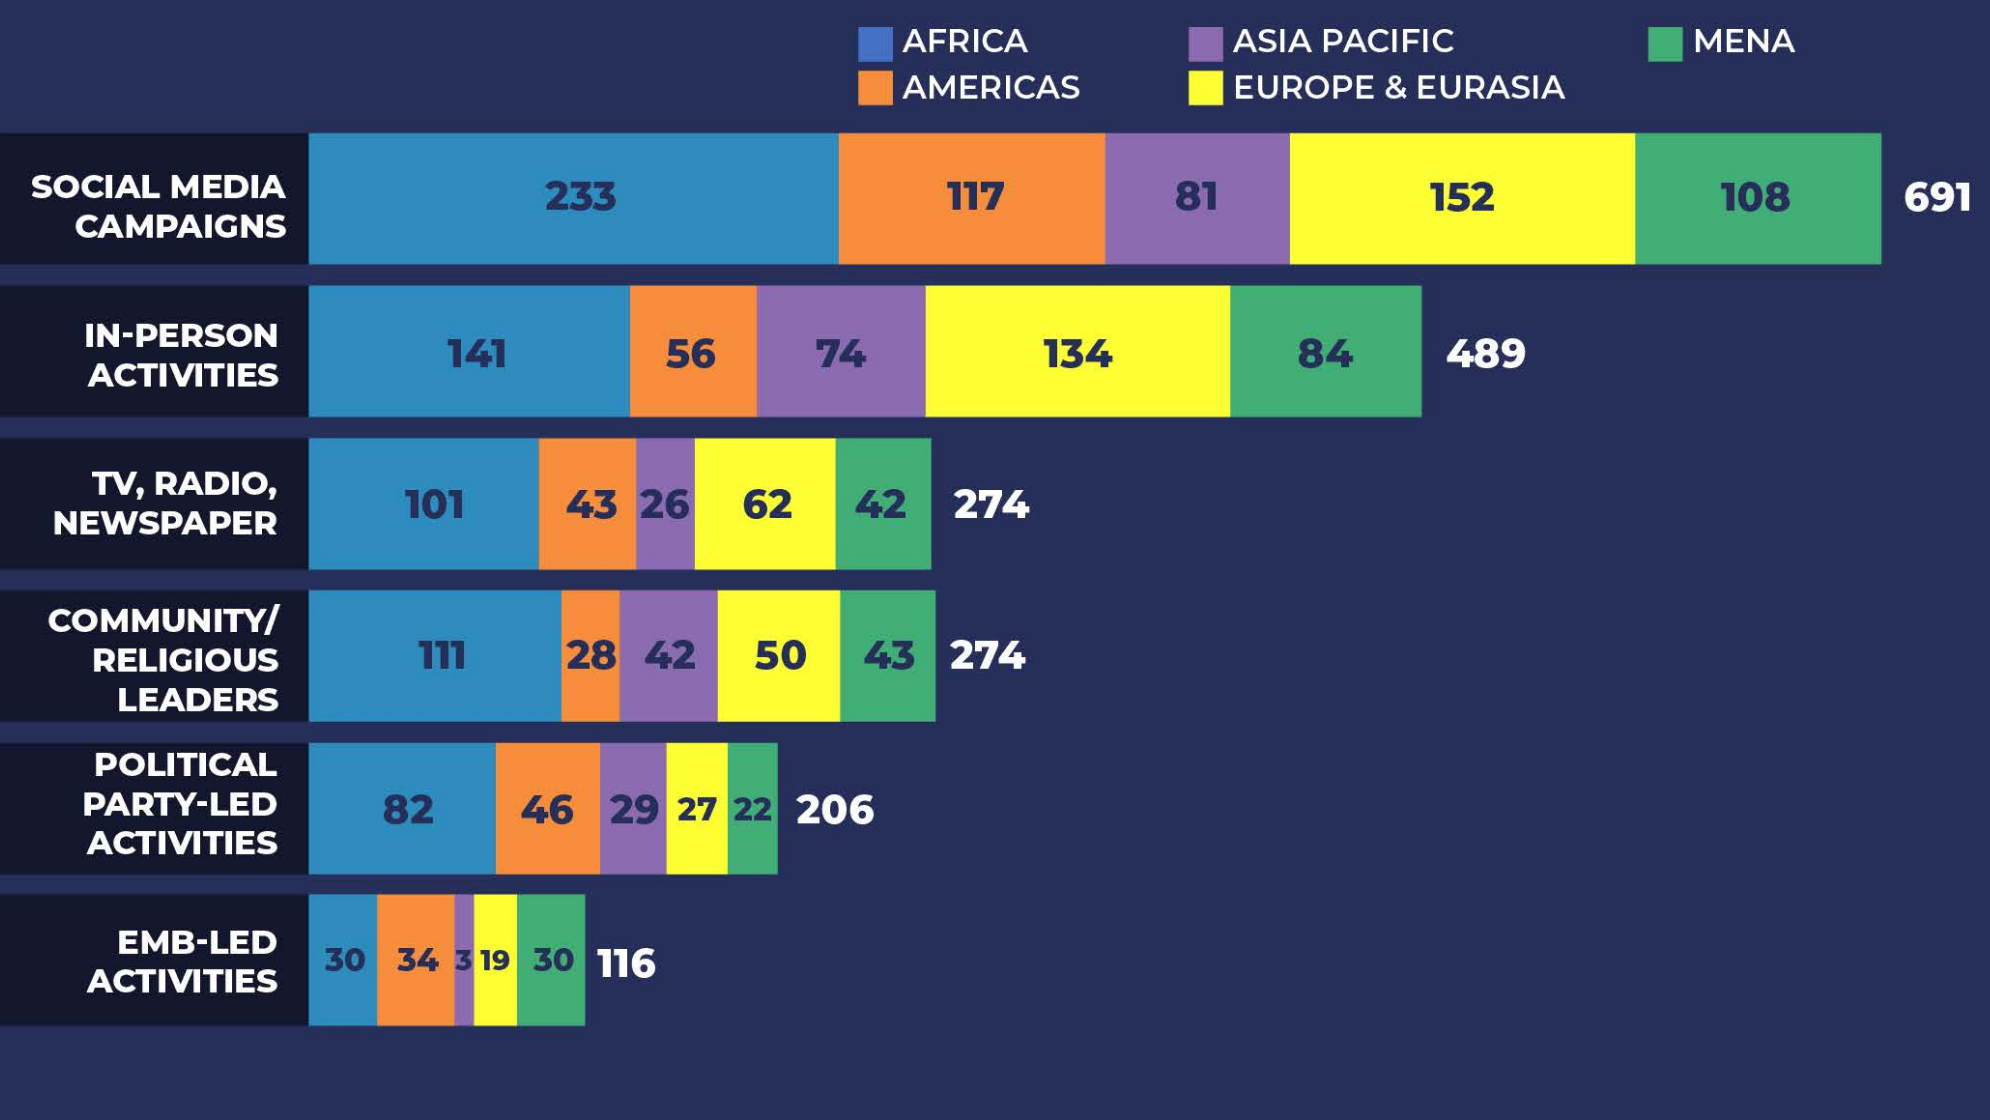
Figure 11 Nonformal Civic Education Methods Reported Most Effective at Engaging Young People, by Region
Figures 12-16


Figure 13 Engagement Methods Reported Most Effective at Conveying Information, by Region

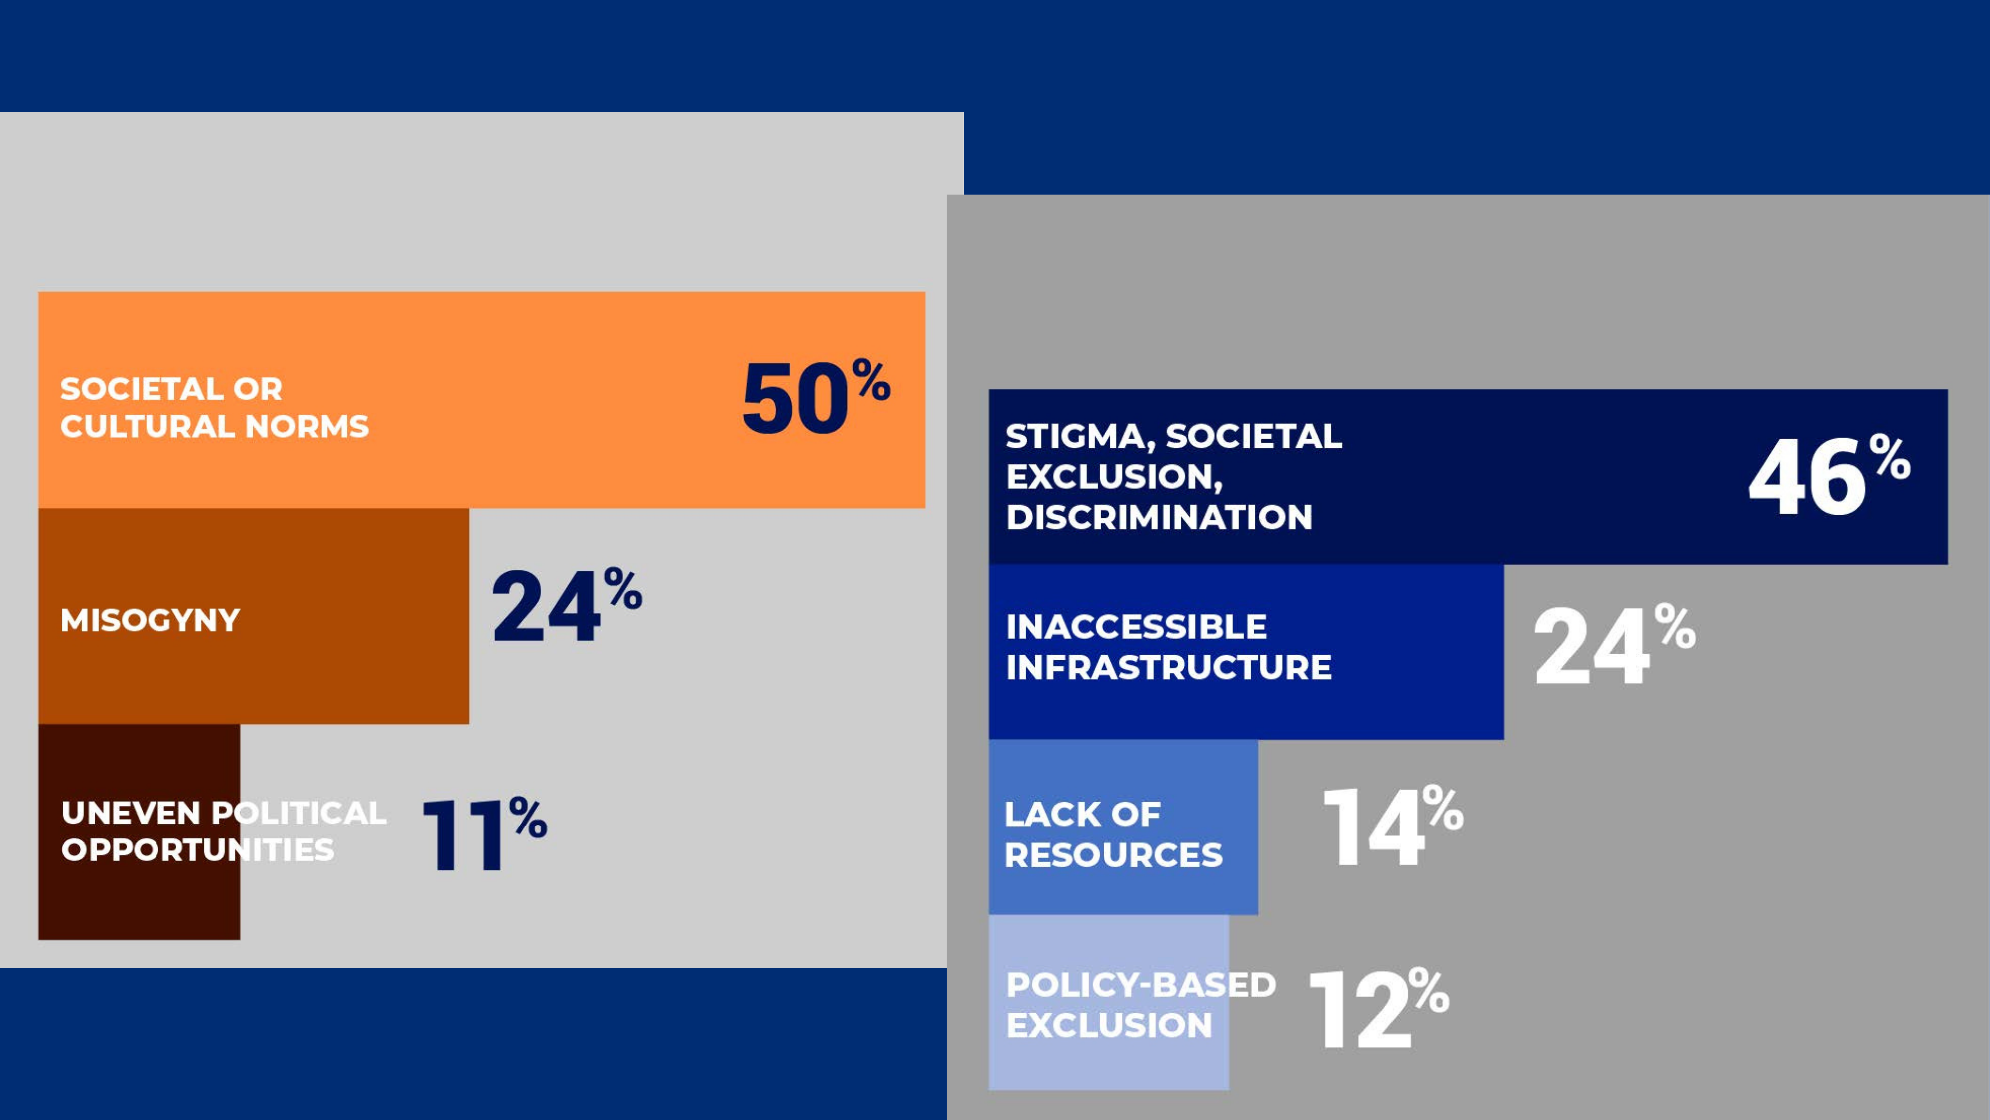
Figure 14 Top Explanations for Why Young Women Cannot Equally Participate
N= 322 Respondents Figure 15 Top Explanations for Why Young People with Disabilities Cannot Equally ParticipatebN= 362 Respondents
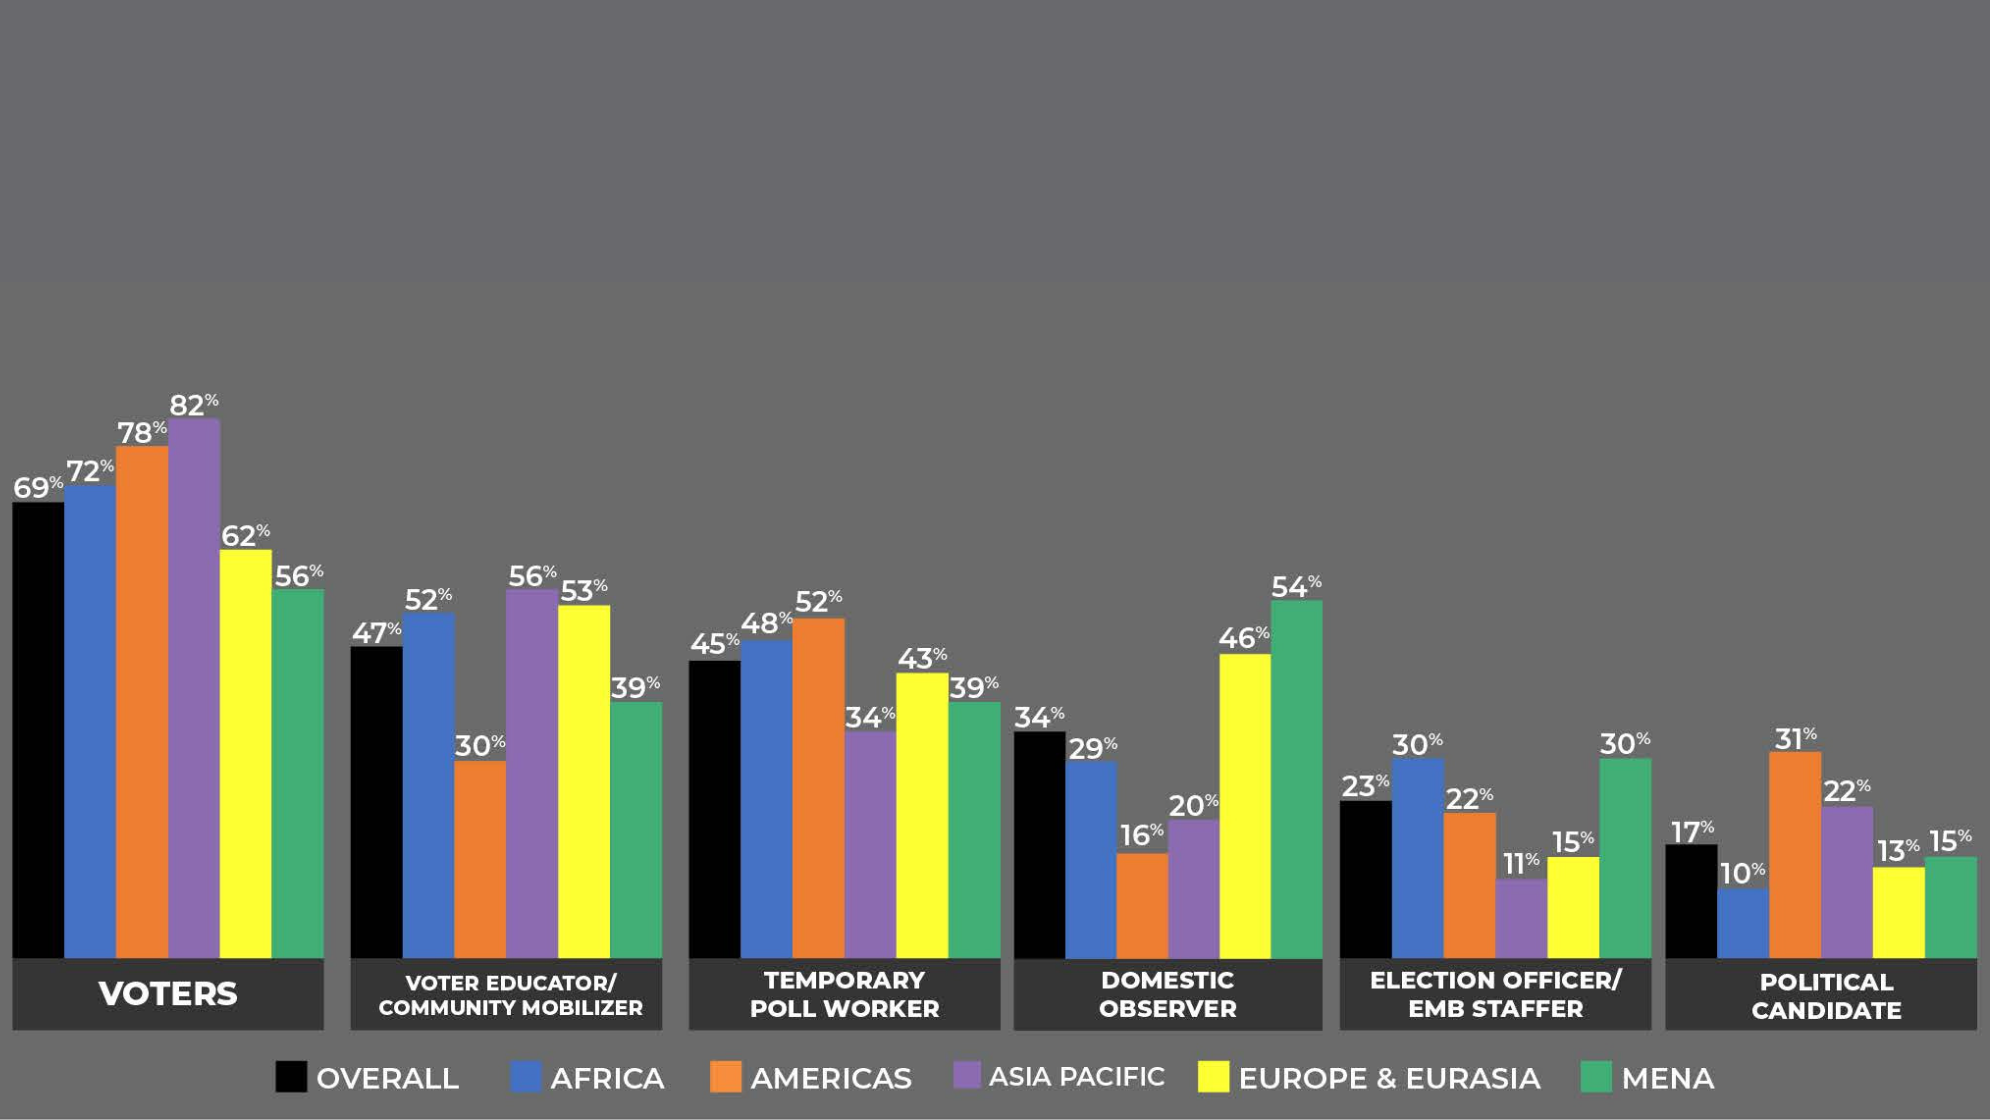

Figure 16 Young People's Observed Electoral Engagement by Region